Phase-amplitude spectra
films and there main properties.
Each voice
or any other sound signal has information about some events or objects.
Visualizing and analyzing of them was, is and will be the most difficult
problem in forensic acoustics. In our days the main voice traces visualization
technology is stile be an amplitude sonogram (or dynamic amplitude
spectrogram).
But
amplitude sonograms visualize not all information about voice traces.
Approximately one half of this information gets out, because of not using phase
spectra.
Valery
Zhenilo tries to visualize phase information and developed computer system
ōSignal Workshopö.
New type of
sonogram he named PASFilm ¢ phase-amplitude spectra film. PASFilm is a set of
amplitude and phase spectra cadres.
There are three types of PASFilm:
Ę
ordinary
amplitude sonogram;
Ę
PASFilm-A
¢ reflects the amplitude increase/decrease of sound trace in one PASFilm cadre
(or in smallest time-frequency domain of investigating signal);
Ę
PASFilm-F
¢ reflects the frequency increase/decrease of sound trace in one PASFilm cadre
(or in smallest time-frequency domain of investigating signal);
Below you can see samples of every kind of
PASFilm. To see pictures in their original size ¢ just click them. You can
listen the sounds which traces are shown on corresponding pictures.
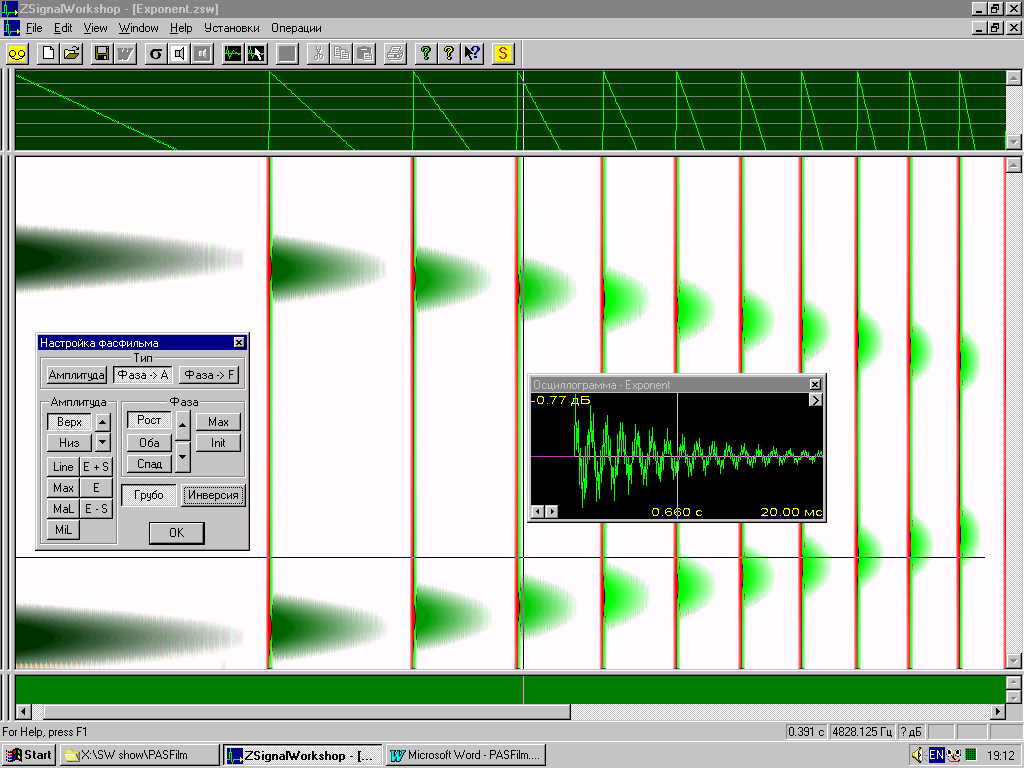
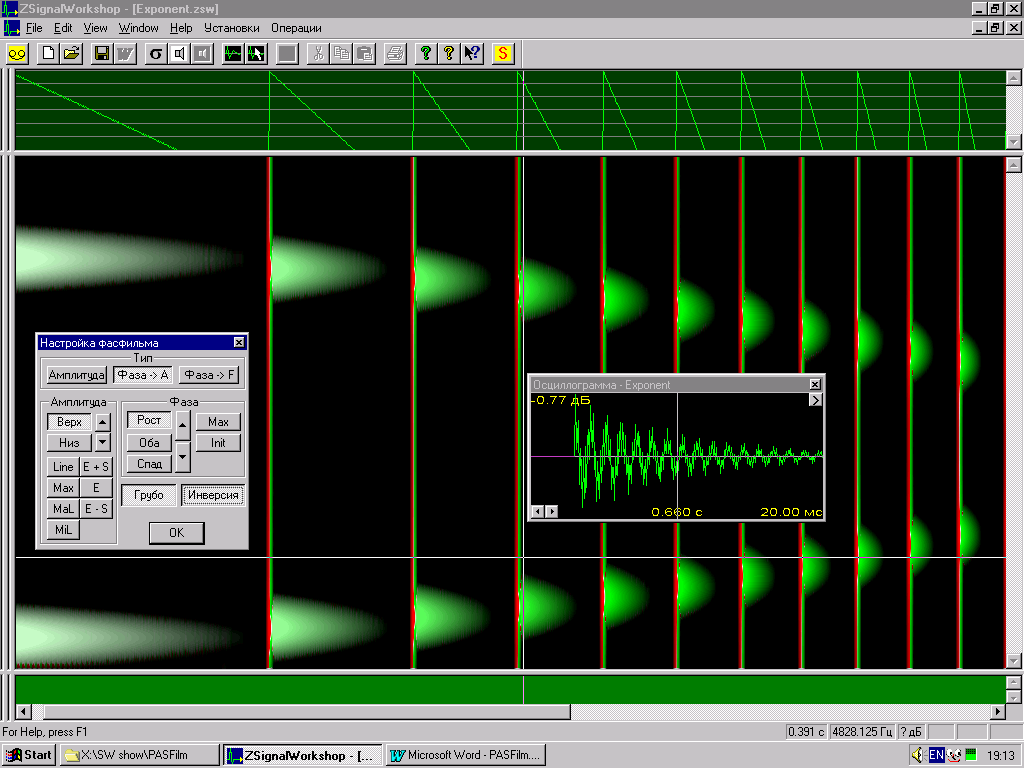
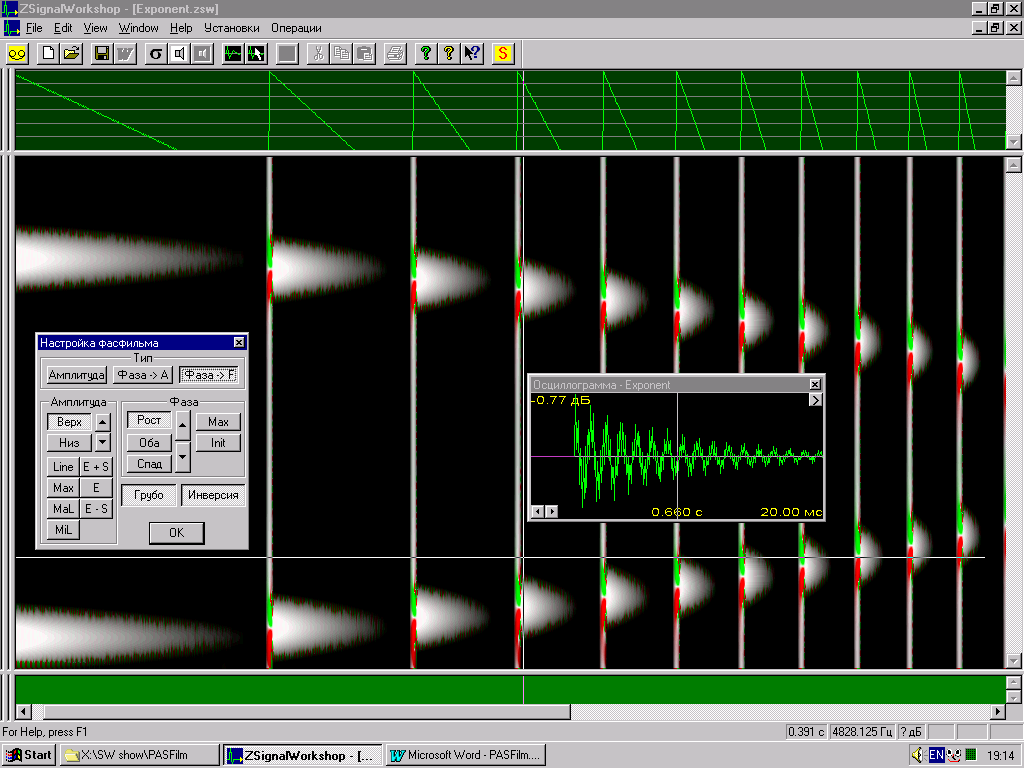
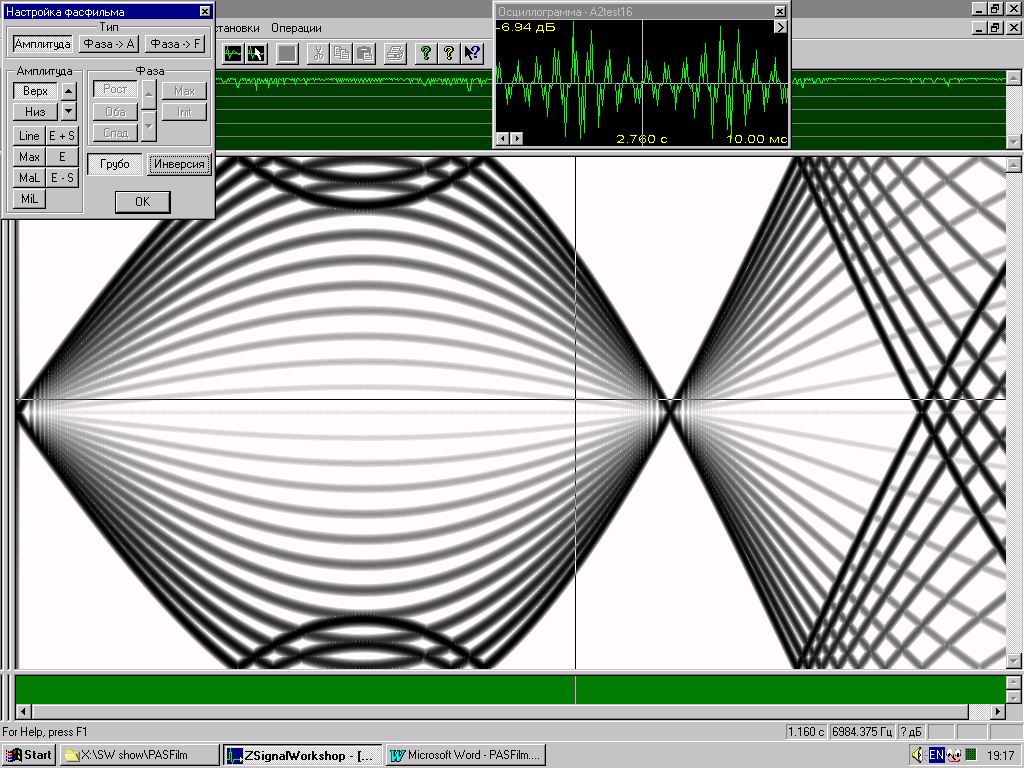
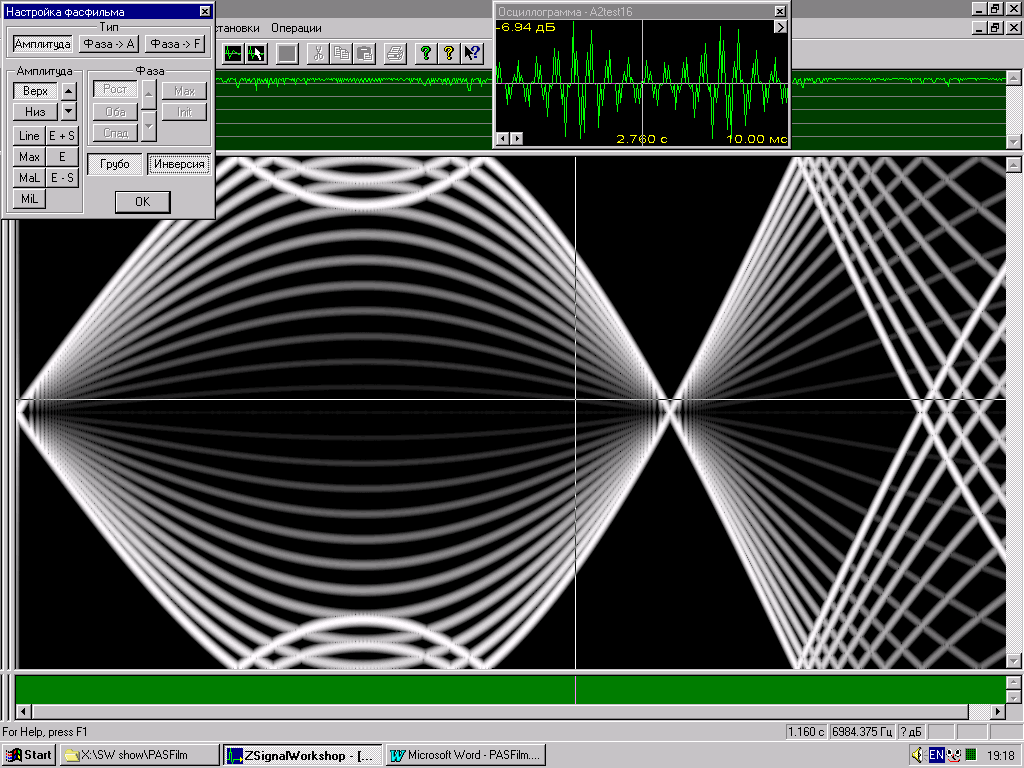
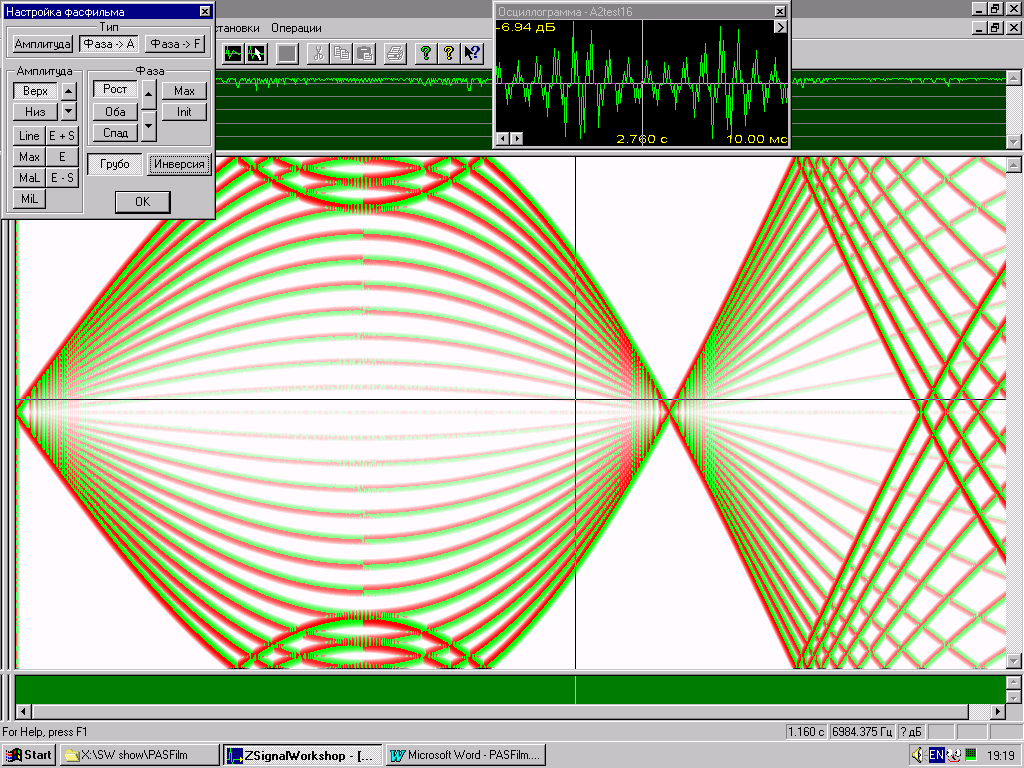
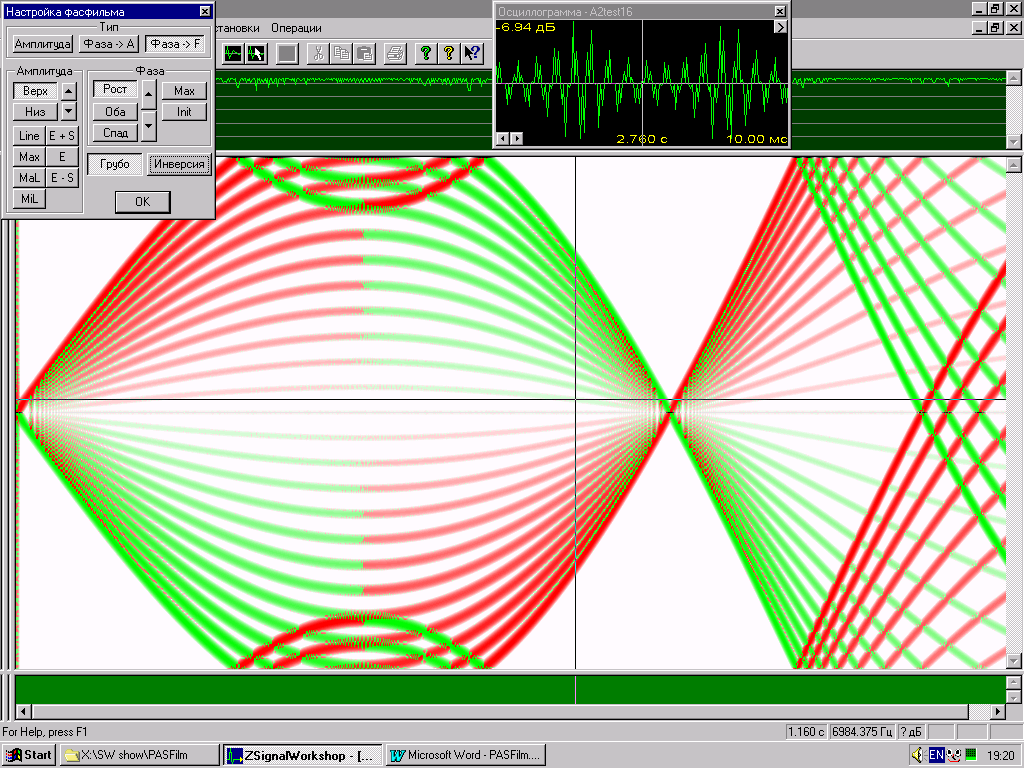
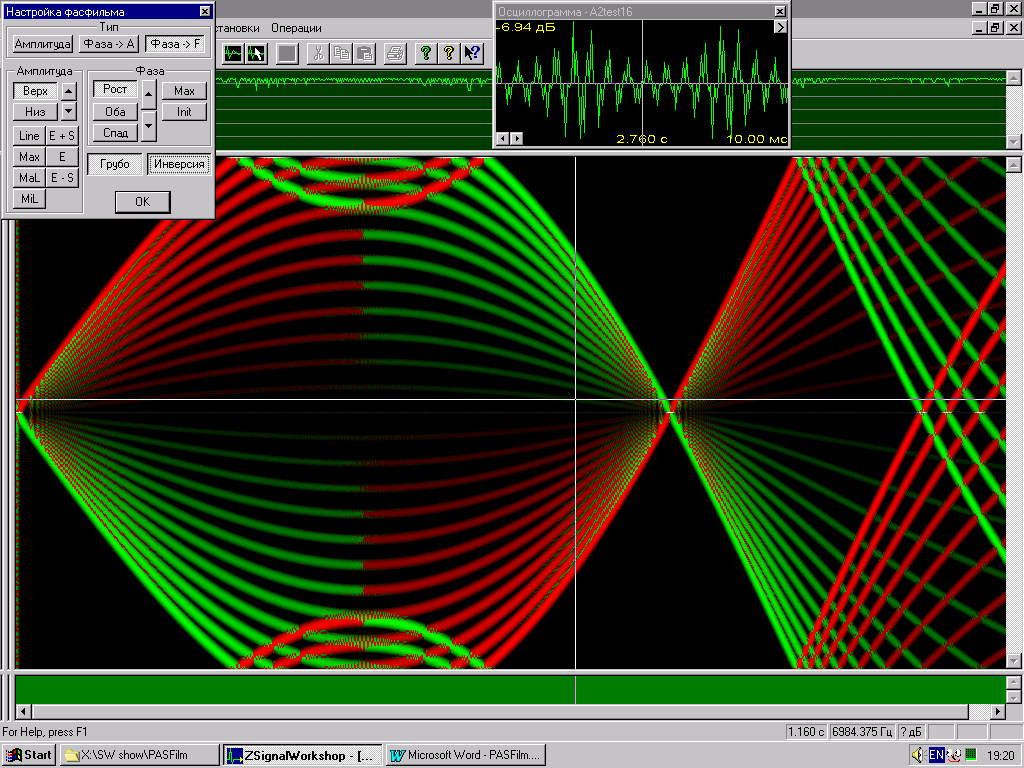
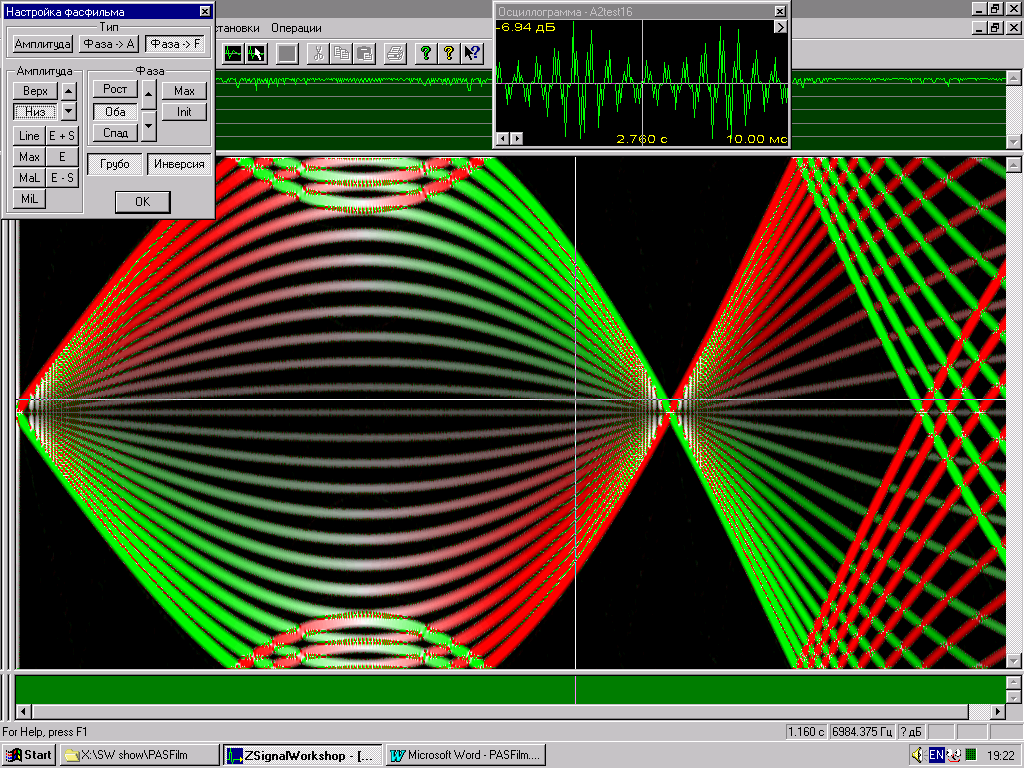
Sample 1. Exponentially
decrease harmonica (or amplitude modulated harmonica).
![]() (
click here to listen shown signal traces)
(
click here to listen shown signal traces)
These are amplitude
PASFilms (or ordinary amplitude sonograms):
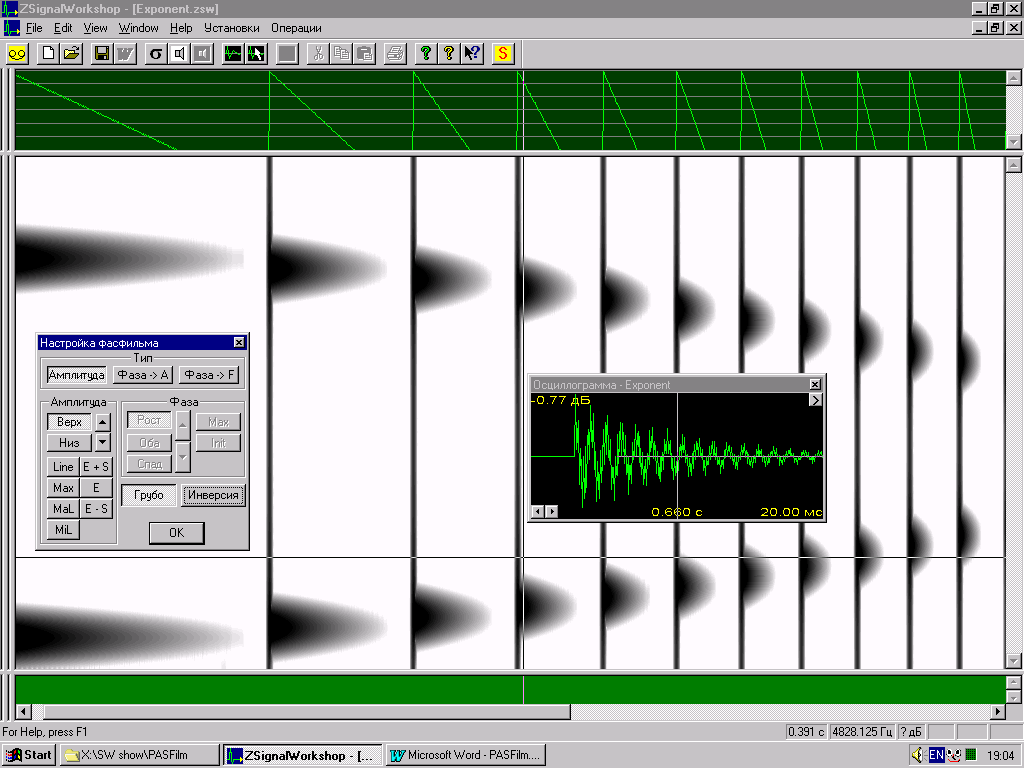
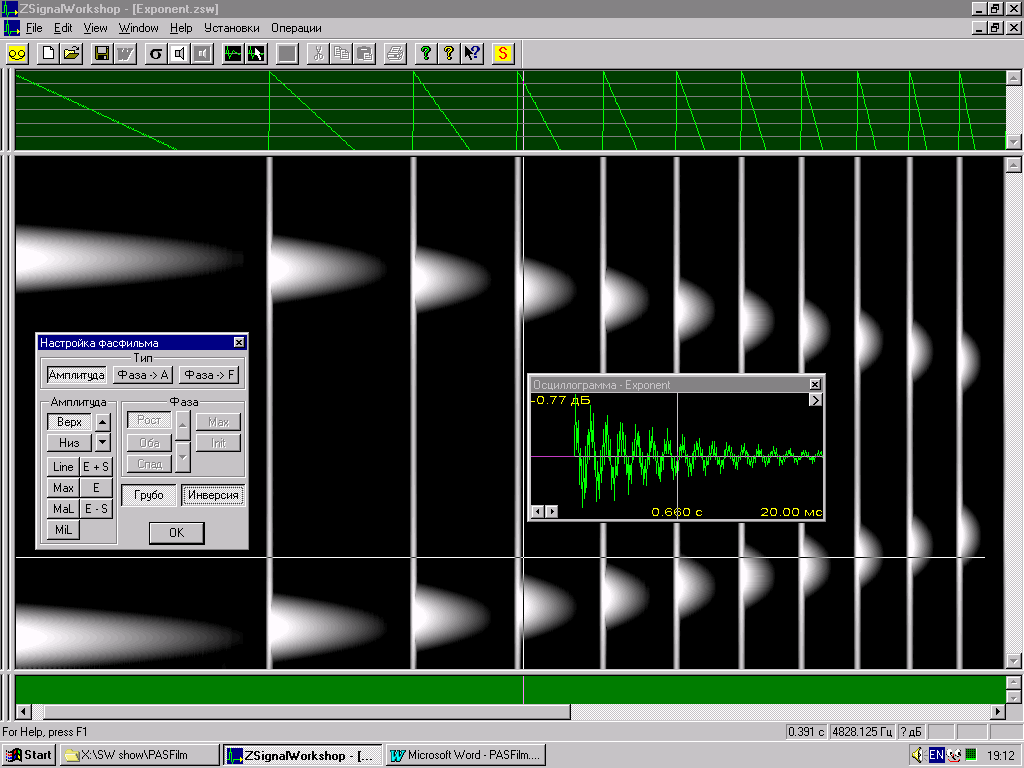
These are PASFilms-A (the
intensity of green color show the decrease intensity of harmonica traces):
These are PASFilms-F (for
someone this king of sonoobject may be not too expressive to understand it
property ¢ see next type of sonoobject ¢ frequency modulated harmonica):
Sample 2. Frequency
modulated harmonica.
![]() (click
here to listen shown signal traces)
(click
here to listen shown signal traces)
These are amplitude
PASFilms (or ordinary amplitude sonograms):
These are PASFilms-A (for
someone this king of sonoobject may be not too expressive to understand it
property ¢ see previous type of sonoobject ¢ amplitude modulated harmonica):
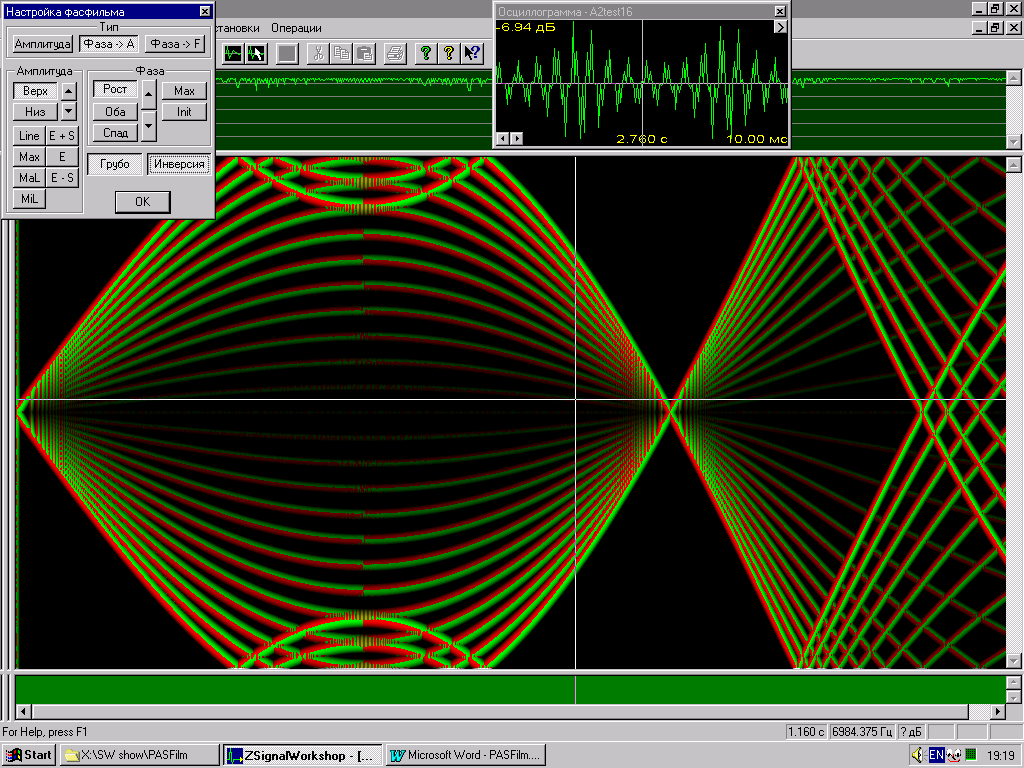
These are PASFilms-F (the
intensity of green color show the frequency decrease of harmonica traces and
red one - the frequency increase of harmonica traces):
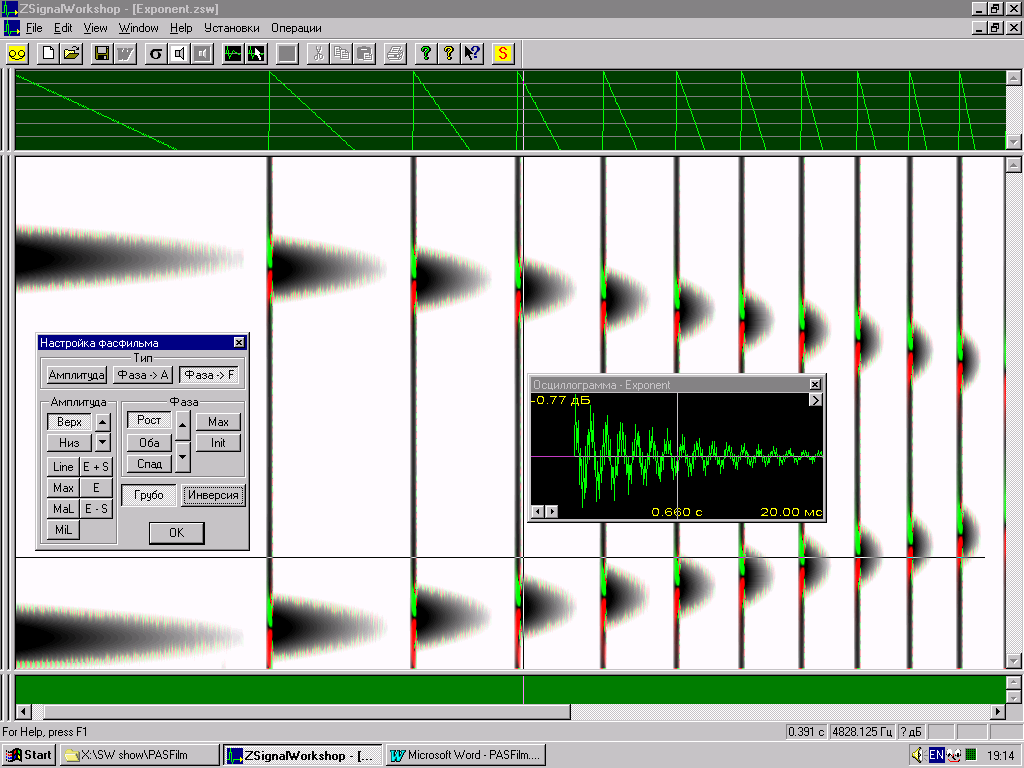
The same PASFilms-F but
coloring levels has another values/ ThatÆs why
traces with nearly constant frequencies loose there color (becomes
gray):
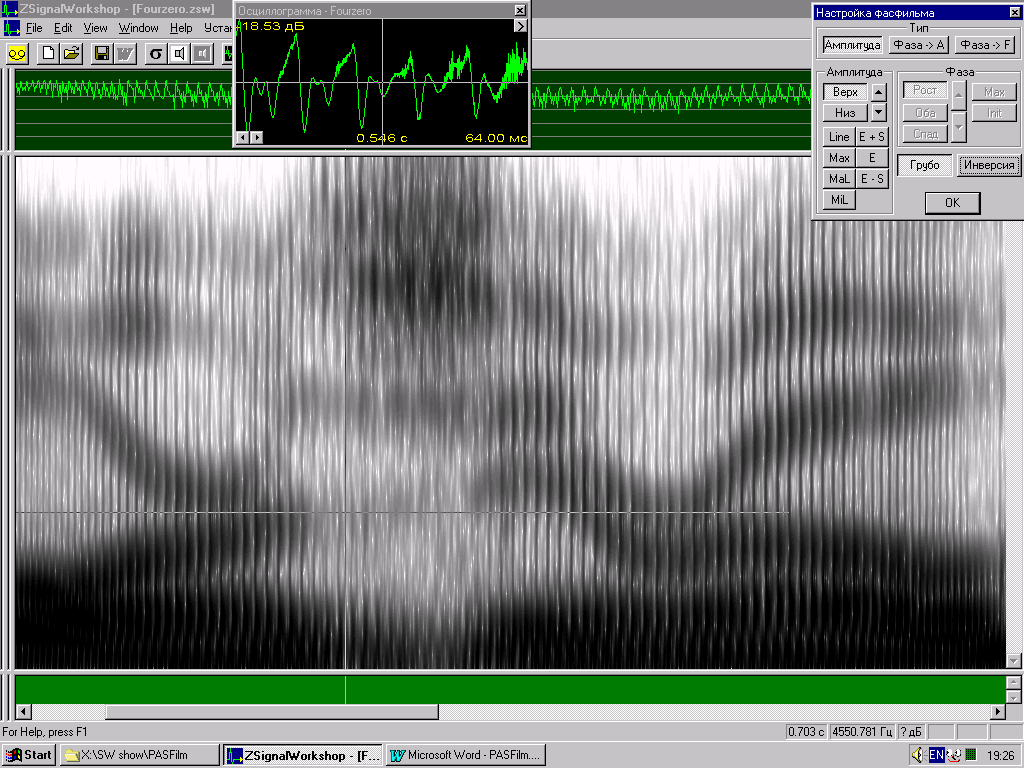
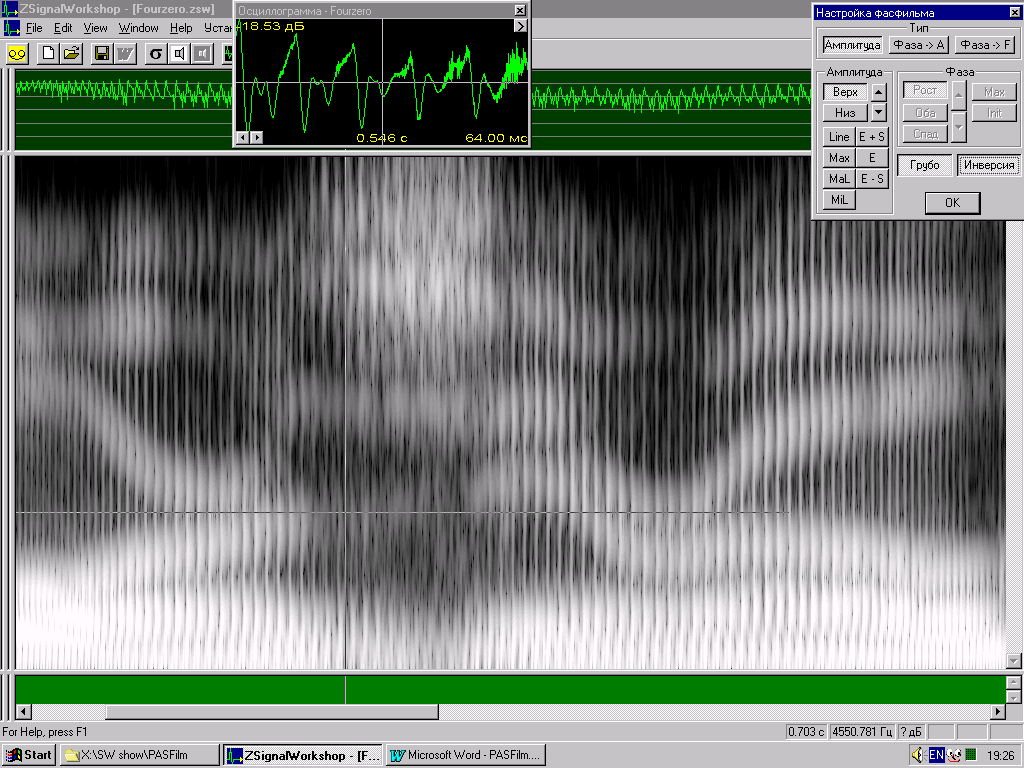
Sample 3. Real well known
speech signal. Wide band spectrum analysis to see speaker articulation traces.
![]() (
click here to listen shown signal traces)
(
click here to listen shown signal traces)
These are amplitude PASFilms
(or ordinary amplitude sonograms):
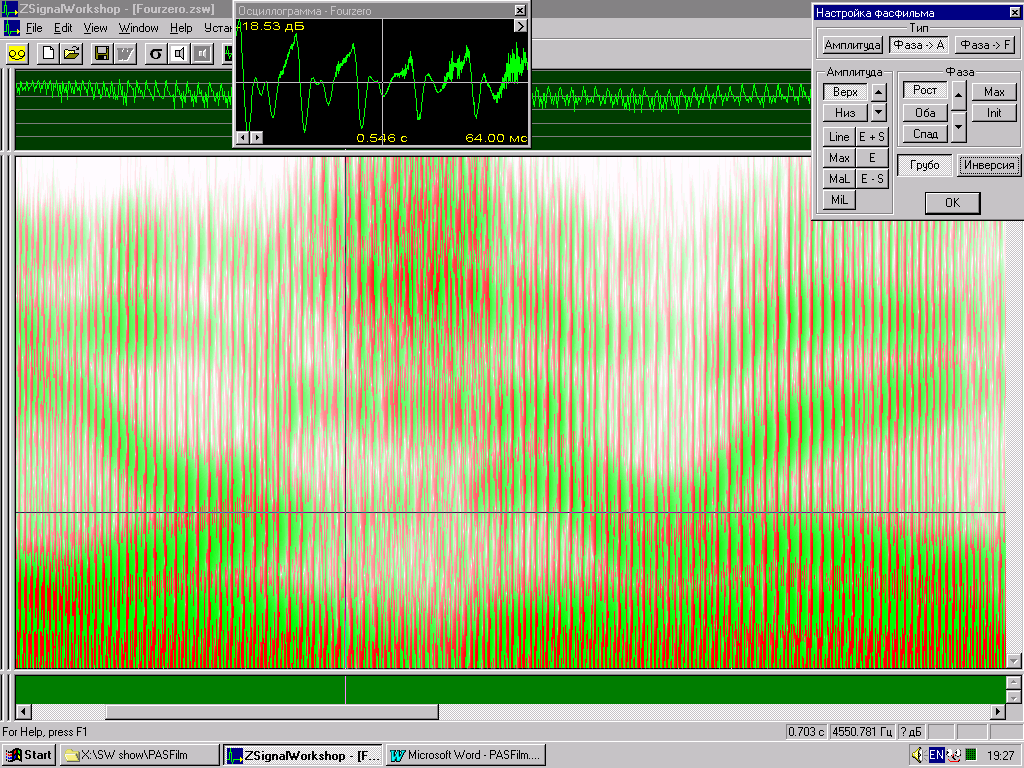
These are PASFilms-A (the
green color show the traces of resonant frequencies of speech tract and the red
one ¢ vocal folds clickers):
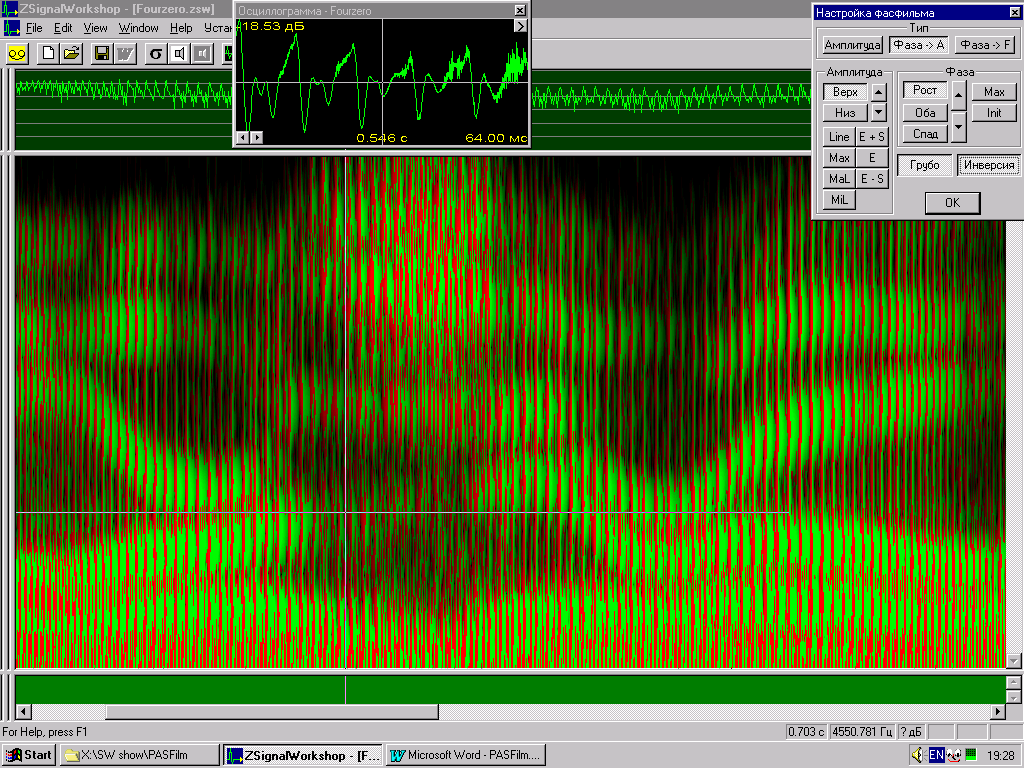
These are PASFilms-F:
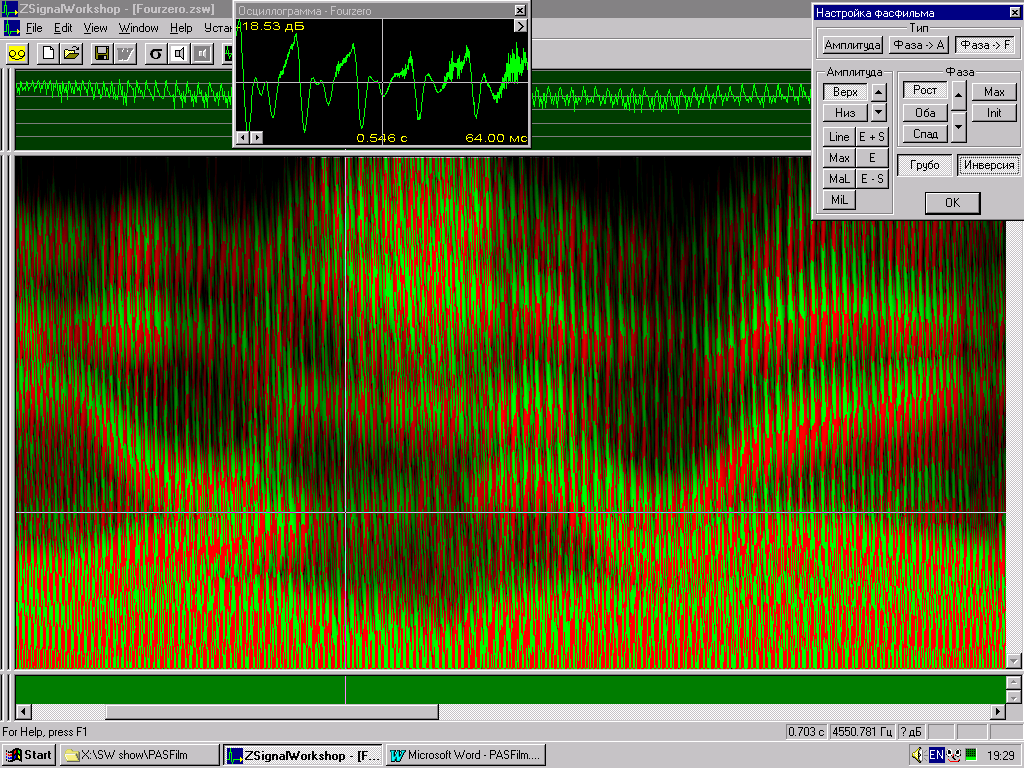
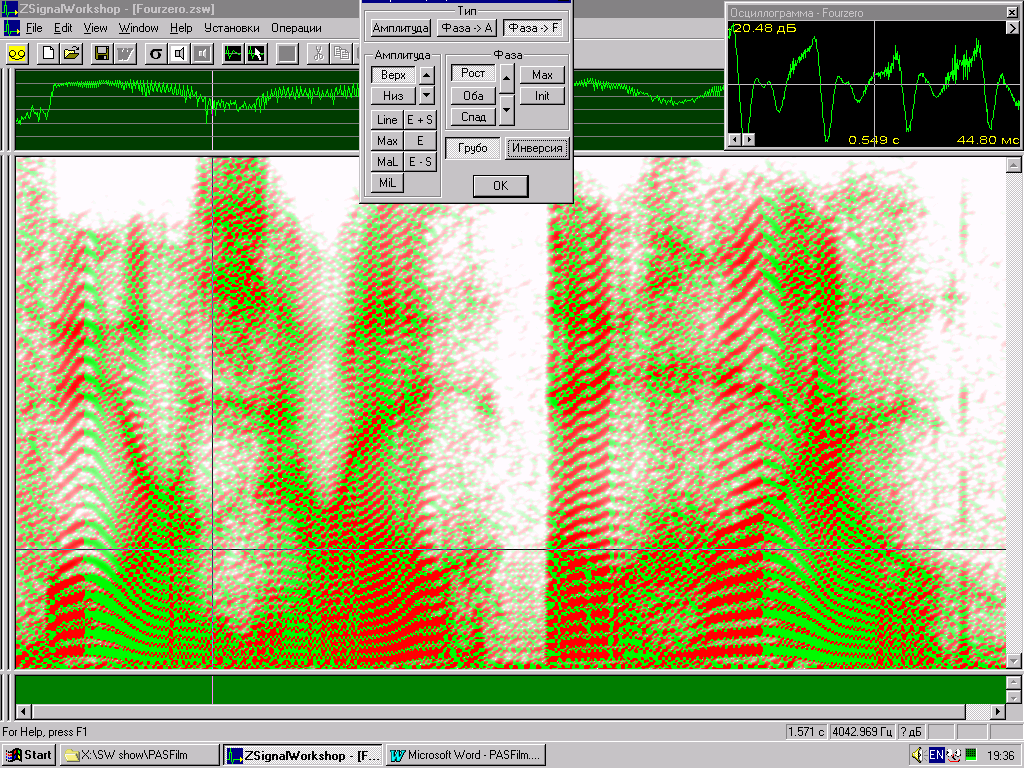
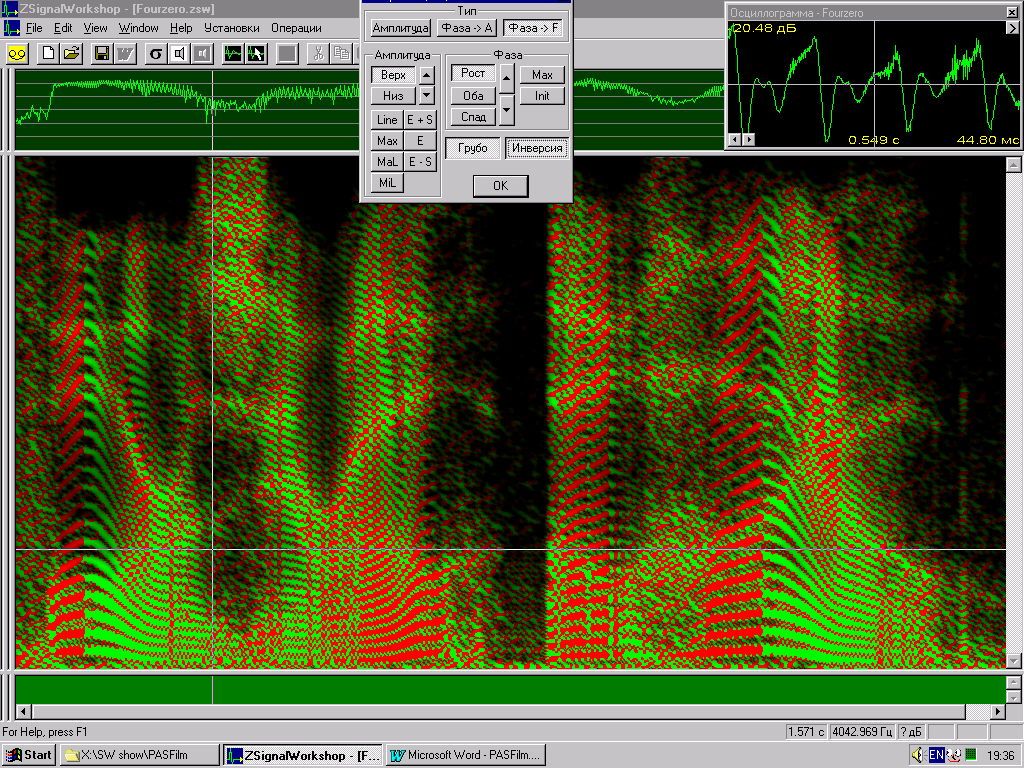
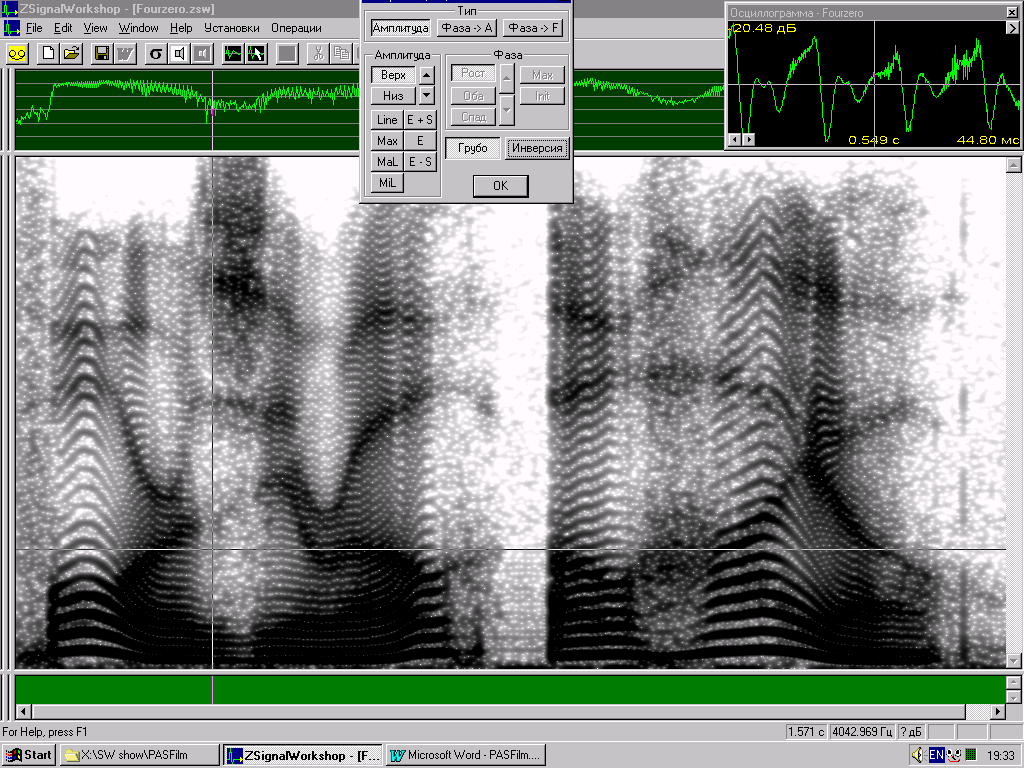
Sample 4. Real well known
speech signal. Narrow band spectrum analysis to see speaker voice traces.
![]() (
click here to listen shown signal traces)
(
click here to listen shown signal traces)
These are amplitude
PASFilms (or ordinary amplitude sonograms):
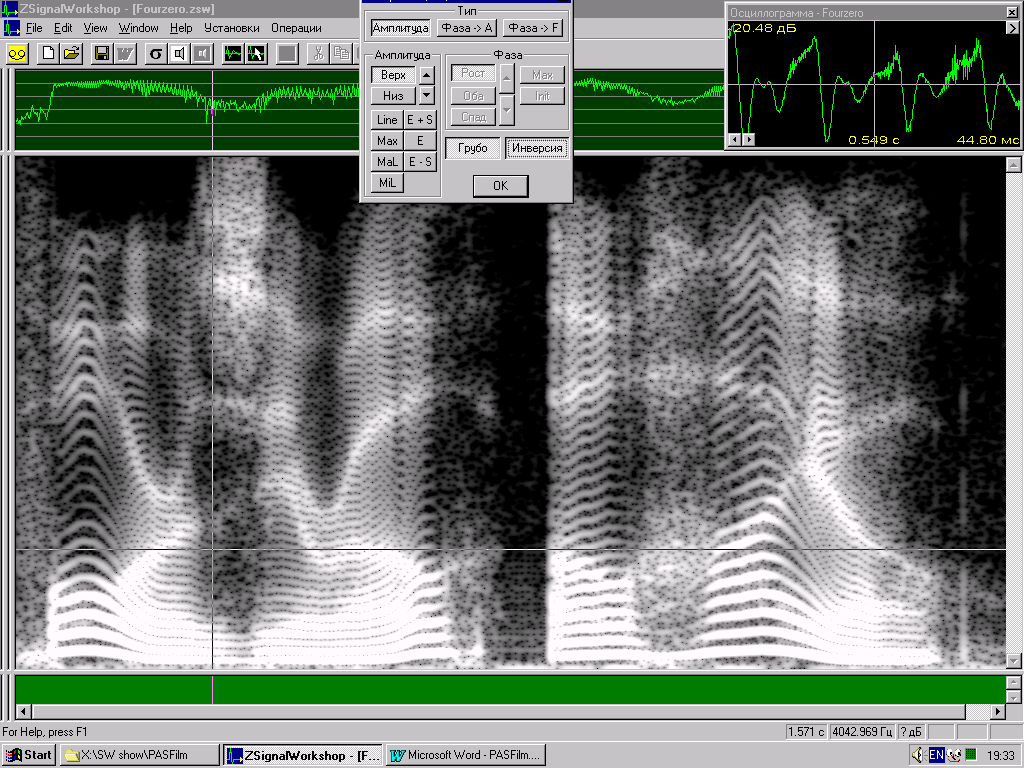
These are PASFilms-A:
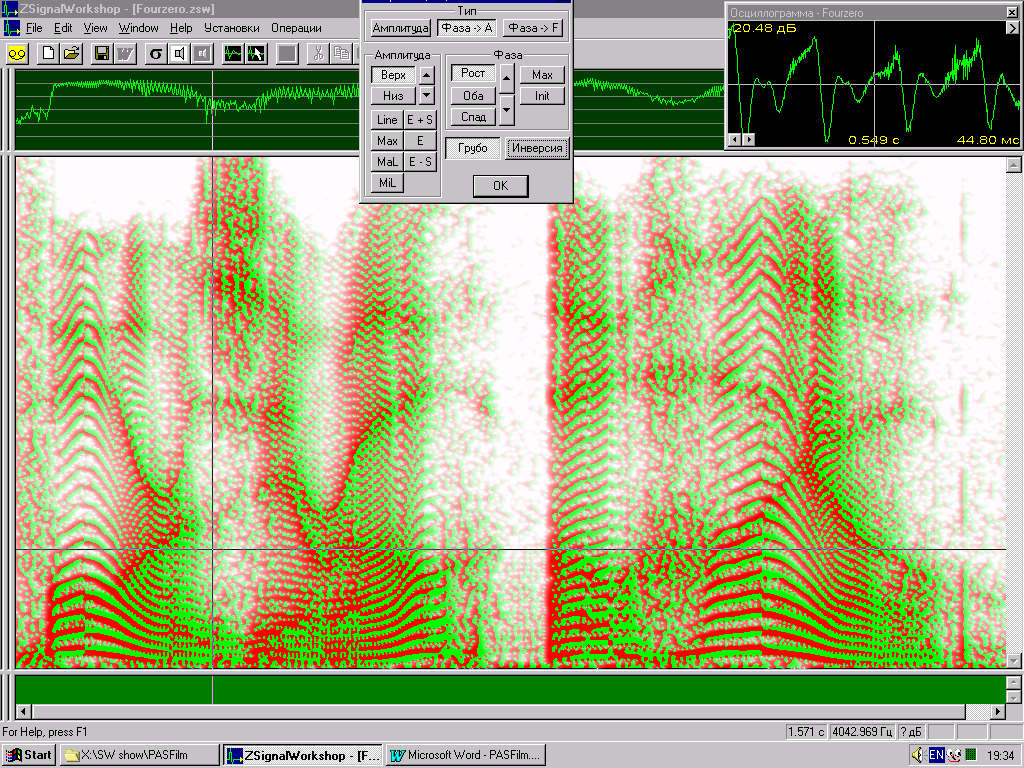
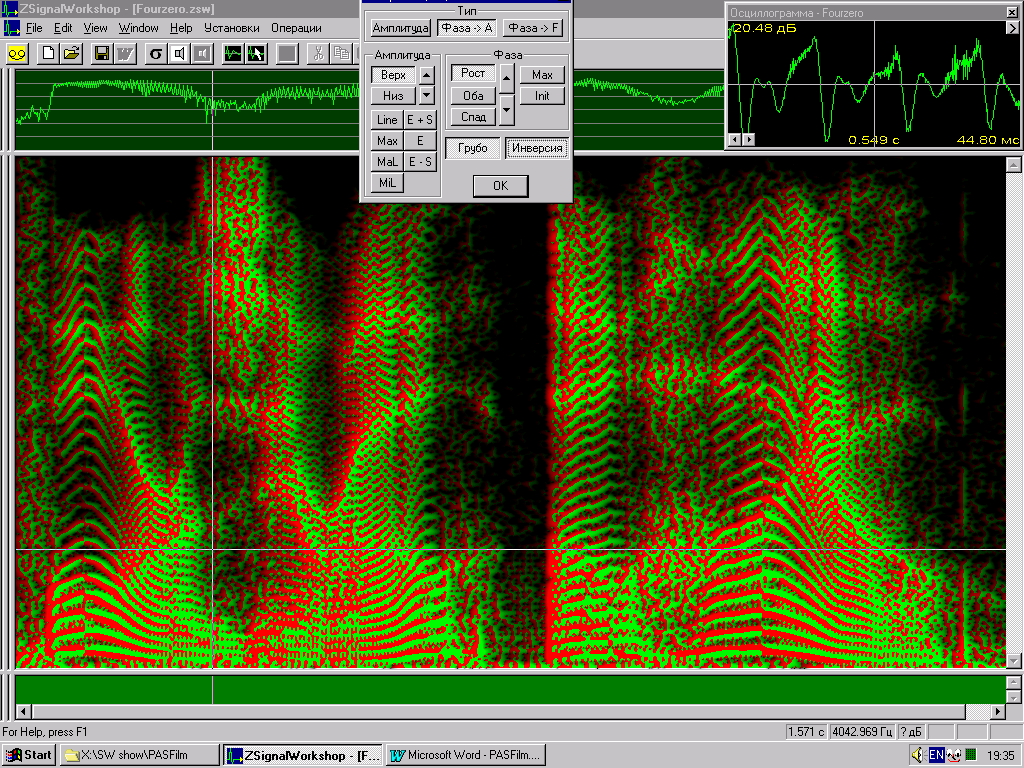
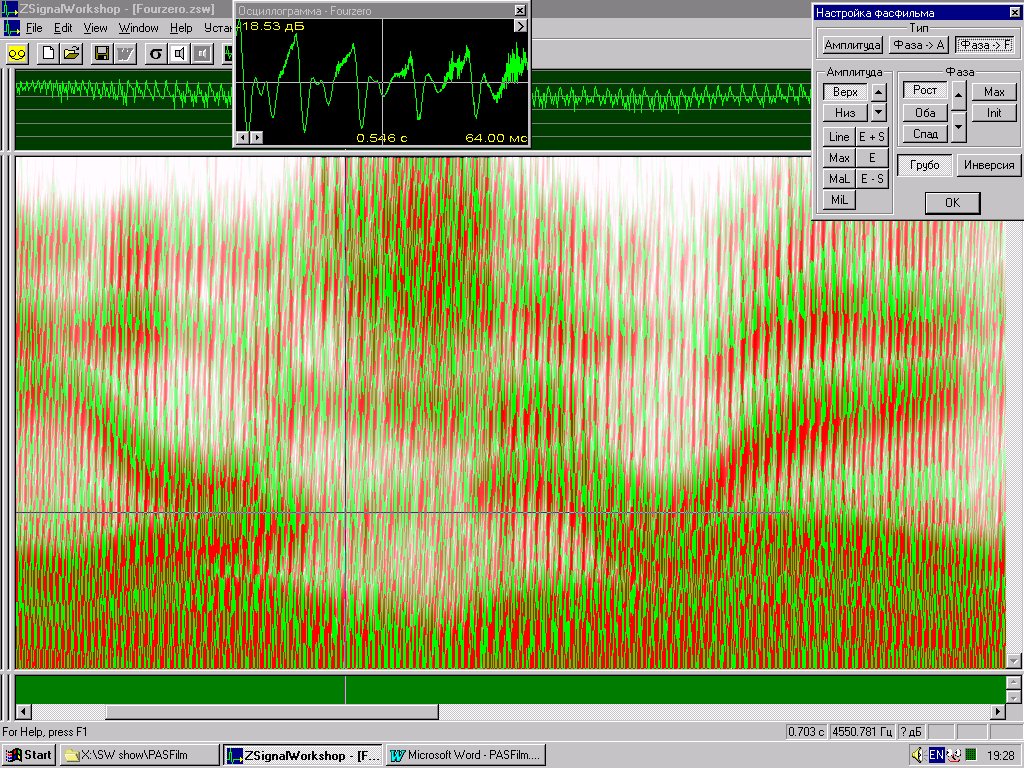
These are PASFilms-F (the
intensity of green color show the frequency decrease of voice overtones traces
and red one - the frequency increase of voice overtones traces):